
DOT carries a market capitalization of $21,982,700,407 with a net circulating DOT tokens of close to 90%. With just above 1 billion tokens in total supply, the potential for this token could skyrocket in the coming days. Blockchain is undoubtedly the most advanced technology developed in the last decade that could address a lot of situations faced in the modern-day.
As blockchains are developed as per the use case and personalized ideologies it might become important to interconnect for supporting data validation. As decentralization becomes the obvious choice for people advocating for corruption-free decision-making processes, the application potential of the DOT token cannot be overlooked.
So far, DOT has increased 500% since its launch in 2021. Find out how much of a further increase is expected in the DOT in the future by reading this Polkadot price prediction.
Polkadot token takes a bounce from the $15 level and is now headed to challenge its immediate resistance of $23. With an all-time high value of $55, the current price trend looks slightly weak. However, if the DOT price persists in the current momentum, it may overcome its 200-day EMA of $28.
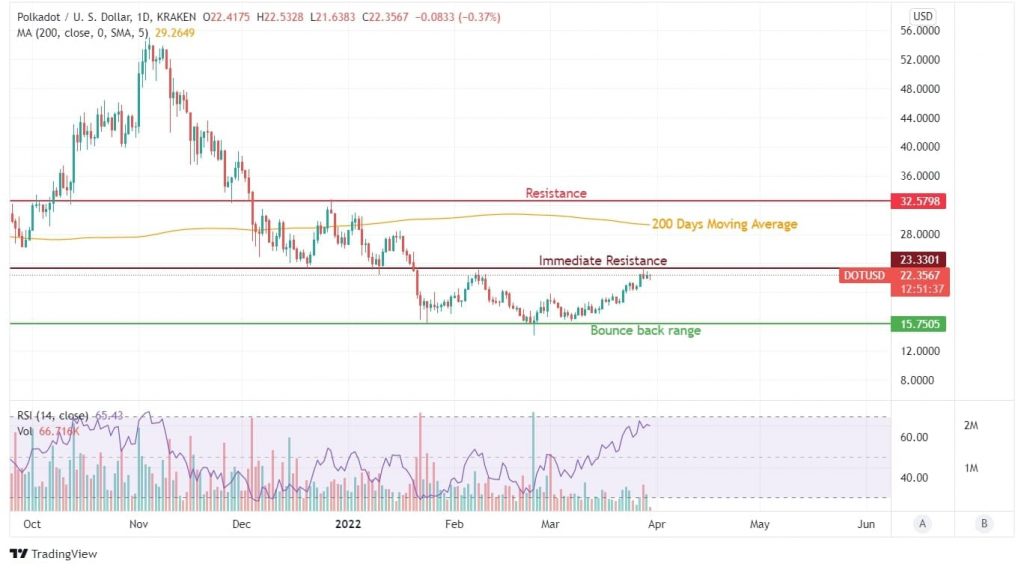
DOT token can slide downside in a jiffy, but retaking the previous high levels would take a much longer time despite an increased and stronger buying sentiment. DOT has revived, but the transaction volumes on daily charts can be seen taking a hit.
The only thing positive in this price trend is the RSI curve that hits a peak value of overbought zones despite the prices having hardly breached their immediate resistance. It could be a result of lesser buyers and even lesser sellers.
The decreased volumes over the recent days could be a temporary demand being created by sellers for dumping their tokens at a higher value. On the other hand, we have the 200 DMA curve that currently moves downwards at around $28.
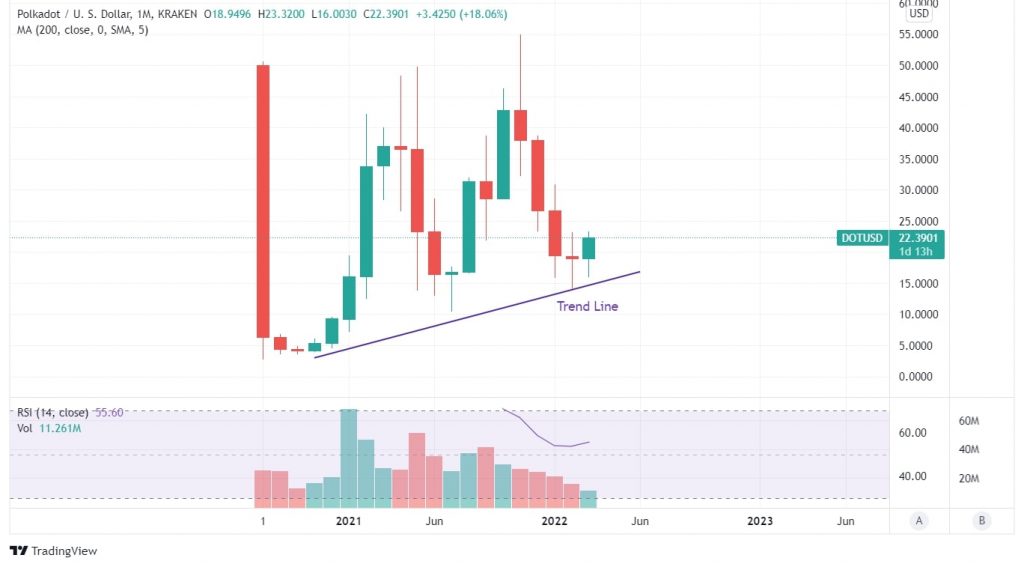
On monthly charts, DOT token prices can be seen undergoing higher volatility but on the foundational levels, they are getting supported in an angular trendline. DOT tokens can be seen growing at the rate of over 200% per year, even on the downside.
Volumetric transactions are still to challenge the numbers seen in 2021, and even though DOT managed to hit a fresh high in November 2021, the token volumes have dipped. It could either be a result of buyers being struck at a higher price or buyers not willing to sell their holdings. Increasing month-on-month transaction volume can remove this negative mark on DOT price movement.